All VTS Strategy Trade Frequency
Mar 05, 2020We have a very large VTS community (members from 57 countries now) and everyone is going to have their own "ideal" trade frequency.
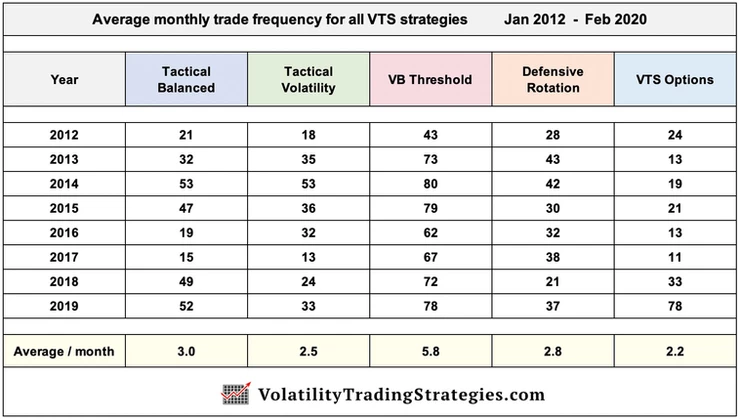
- Some may look at the table below and think it's not active enough for you. In that case I'd say you could use these strategies as the core of your portfolio because of their consistency, and then there would be nothing wrong with dedicating some capital to more active strategies either by your own design or perhaps with the help of another service if that's something that interests you.
- Others may think it's a little too active. In that case I would say you can contact me directly and we can talk through some considerations to perhaps reduce frequency, or shave down the number of strategies you follow from 5 to maybe 3 or even just 2.
But all the strategies are optimized to meet specific goals and I don't really fine tune the final trade frequency as a variable. If I feel the goals of the strategy are met and it happens to be with 2.5 trades per month (Tactical Volatility) then so be it. If I feel like nearly 6 trades per month (VB Threshold) checks all the right boxes for what I'm trying to achieve then that's what I'll do.
You can always adapt this to your own investing style:

* Remember for VTS Options, from 2012 - early 2018 the strategy was just trading 1-3 Iron Condor option spreads per month and wasn't nearly as active as it is now. It's now fully diversified into all option types so going forward I expect trade frequency to be around 7 or 8 trades per month on average within VTS Options.
So if we exclude VTS Options (and it's a separate service now so that's easy to do) we end up with 4 ETF rotation strategies with a total monthly average trade frequency of 14.1 combined.
Since there are an average of 21 trading days in a month, that means roughly 2/3's of days we will have trades. Now there are many days where 2 or 3 of the strategies have an active trade signal on the same day, so I would imagine there is quite a bit fewer days to make trades than 14. I just thought of this when I'm typing up my blog, but I should plot all the trades including the overlap and see how many actual days there were actions being taken. My initial guess is about half, but I'll put that on my to-do list which should be interesting.
* The average American spends about 1,800 hours a year working. (38.5 hours a week and 46.5 weeks per year). That's how much on average people dedicate to building their income and providing for themselves and their family.
I don't think it's too much of a stretch for people to spend 10-15 minutes a day just making sure it's being invested safety and profitably in the long-run.
Now of course buy & hold is an option, but let's not pretend it's a very good one. The S&P 500 is one of the best performing indexes in the world and studies show that roughly 85% of fund managers underperform it. So what does one of the best indexes in the world return long term?
The last 20 year period has included 2 bull market periods and 2 crashes so it's a great time frame to get the most accurate picture of long-run performance.

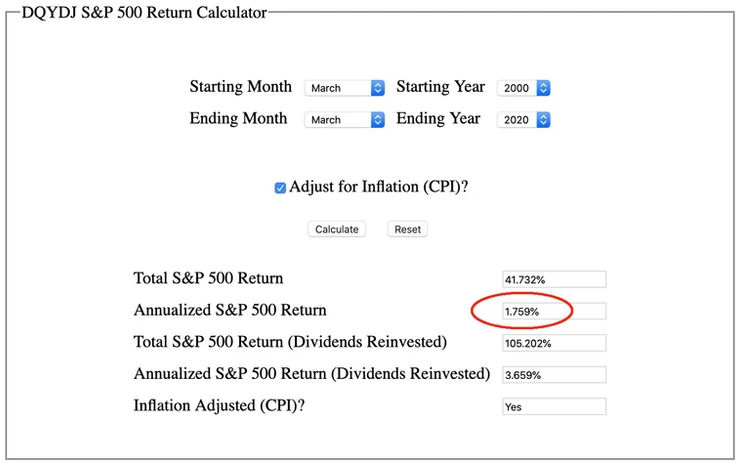
Over the last 20 years when adjusted for inflation, the S&P 500 has returned an annualized 1.76% a year. Yes you read that right, 1.76% a year! Even with the compounding of reinvested dividends over 20 years it's still less than 3.7% a year. That's what 85% of fund managers have a hard time beating. The old diversified buy & hold pie chart style of investing at best makes a couple percent a year in the long run. Bull market to bear market and back again, rinse repeat for about 1-3% a year... No thanks.
So with a little added trade frequency and a carefully constructed Total Portfolio Solution, I plan on destroying that over my career and I'm glad you're here for the ride. The new Defensive Rotation strategy is a nice addition to the portfolio.
Take Control of your Financial Future!
Profitable strategies, professional risk management, and a fantastic community atmosphere of traders from around the world.

