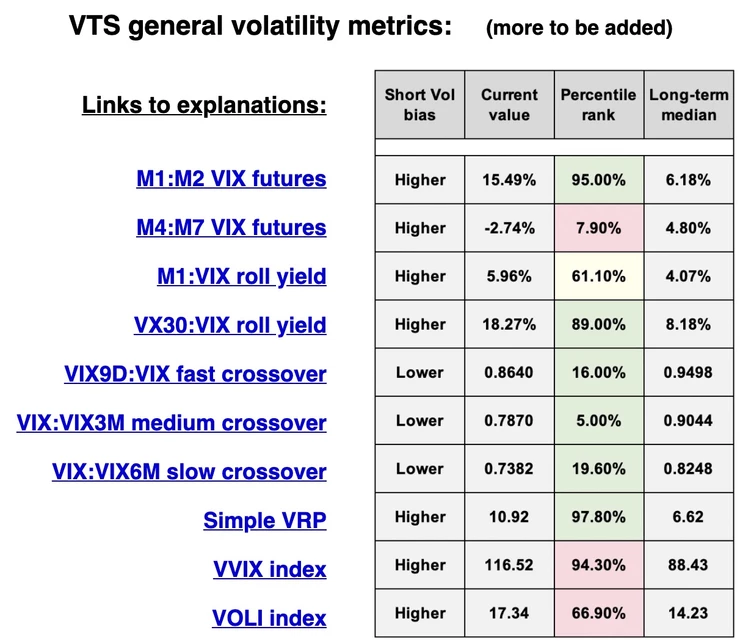
General Volatility metrics dashboard - Short Vol bias, percentile, median
Aug 12, 2020I have updated the General Volatility metrics data table to be the same as the Specialty Volatility metrics table above it. Just keeping the 4 headings the same in both tables for consistency and to make it easier to see at a quick glance. Let me just review what those headgs mean.

Short Vol bias:
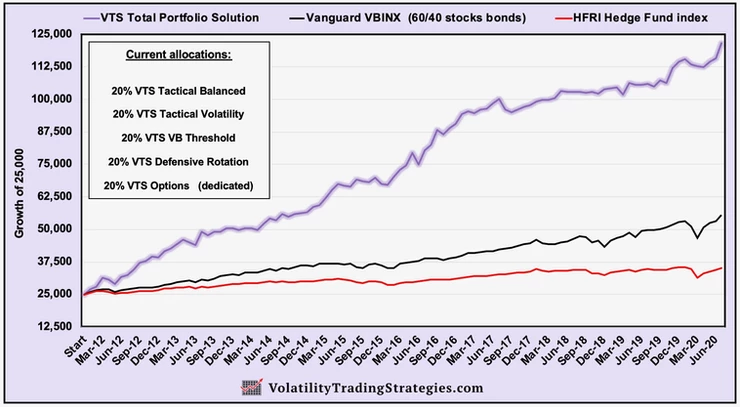
The VTS Total Portfolio Solution is a completely diversified portfolio, and my evidence that backs up that claim is that in the nearly 9 years since I launched it, the portfolio has only suffered a few low to mid single digit drawdowns. Even through the craziness in the last 3 years, the max drawdown since January 2018 was -2.6%. So it's clearly designed to be a smooth diversified portfolio.

Having said that, "short volatility" is the component within it that I think gets the most people excited. Depending on how it's allocated at the time, short vol may be anywhere from 20-40% of portfolio so it's enough to say that we really do care about the bias to when it's most advantageous to be short volatility. That's what the first column is showing.
Take M1:M2 VIX futures for example, the first metric on the list. It's more advantageous to be short volatility when the front two month VIX futures are in contango (M2 > M1) so we want that value to be as high as possible. That's why the "Short Vol bias" for that first metric says higher, and you can see the short vol bias of all the other metrics as well.
Current value:
Pretty self explanatory, this is the current value. So again using that first metric as our example, as of data collection time M1:M2 VIX futures contango is 15.49%. The "current value" is just where the metric is at right before the daily email is sent out.
Percentile rank:
Understanding percentile rankings may be one of the more valuable things a trader can do, because the fact is every market environment is different. If a trader is in the habit of trying to use absolute values to base trade decisions on, they may be setting themselves up for disappointment when things don't exactly repeat themselves going forward. History does rhyme, but it doesn't repeat so absolute values are less useful for trading.
It's not enough to know that M1:M2 VIX futures contango is positive and 15.49% right now. What matters far more is, how high exactly is 15.49%? Historically speaking I mean, where would that value rank compared to all other values of the past? That's far more important than the absolute value.
Percentile rank shows where a current value is compared to all other values of the past. It's on a scale from 0% (lowest) to 100% (highest) and it's the best way to actually put these raw values into the proper historical context.
So for M1:M2 VIX futures contango, how high is 15.49%? Well as the table shows, that is a percentile ranking of 95.00%. That means 15.49% is higher than 95.00% of all values going back to the launch of VIX futures in 2004, and it's lower than only 5.00% of those values. Basically, it's very high and historically speaking, M1:M2 VIX futures contango doesn't often get this high. But again the absolute value doesn't tell us that. The only way to know is to actually see the percentile ranking as well.
Long-term median:
It's always valuable information to know what a volatility metrics long term average is. With that we can make meaningful comparisons as to where we currently stand in relation to it.
Median shows the exact middle number in a series of numbers. So if we were to rank all the daily values going back to the launch of VIX futures on March 26th, 2004 from lowest to highest, the exact middle value of M1:M2 VIX futures contango is 6.18%.
I prefer median to mean, because with mean (average) that can always be dragged up or down by extreme outlier readings. For example the long term mean average VIX is going to be dramatically increased by the fact that it does occasionally get into the 80's. Those extreme high values pull up the mean.
Median is just showing the exact middle number making it far more meaningful in most cases.
Taken as a whole, there's quite a bit of information within those volatility metric tables for those who take the time to understand them. Now obviously it's not required. You can easily follow the VTS portfolio without ever looking at those numbers. VTS is mostly about the quality of the long-term performance of the Total Portfolio Solution and it's fine if that's all you're interested in.
But the volatility metrics are the optional education side of my work and you're welcome to learn at your own speed and ask questions.
Continuing with the example of M1:M2 VIX futures.
1) Using the table we can see that the higher the value the better for short volatility positions, and by proxy, long stock market positions.
2) We can see the current value is 15.49%
3) We know that's very high historically because we can see it has a percentile ranking of 95.00%.
4) And lastly, we are also miles above the long term median of 6.18% so again, contango is quite high right now.
But let me throw a curve ball at you, uh oh, there are only 6 days left to VIX futures expiration (insert scary music). What does that mean?
Well if you've been learning from my articles and videos, it means with only a week to go in the cycle, you may want to start favouring the VX30:VIX roll yield metric more than the raw contango value. I'll save that for a refresher blog soon :)
Take Control of your Financial Future!
Profitable strategies, professional risk management, and a fantastic community atmosphere of traders from around the world.

