Volatility Metric: VTS Traders VRP - Volatility Risk Premium
Sep 27, 2019VTS Community,
The Traders VRP metric is a continuation / improvement on the Simple VRP metric I introduced previously. If you missed that Simple VRP article you can check it out below, but I will also just cut and paste the definition section again today just as a quick review.
Simple VRP - Can the Volatility Risk Premium be used to time the markets?
Defining the VRP:
VRP stands for Volatility Risk Premium, and it's a central concept that drives a lot of the pricing we see in financial markets. Before we specifically get into what the VRP is with respect to trading though, we can first view it through the lens of general insurance.
When you're buying insurance, whether that be car insurance to protect against damages, or fire insurance to protect your home, you're essentially paying a premium upfront to be protected against potential unknown events down the road. If an unfortunate event should occur, without insurance that cost may put you in serious financial jeopardy. You could lose your home, or your car, so it may be worth it to pay a small regular premium to eliminate that risk. The insurance company is willing to cover the cost of those events if they occur in the future, and they charge you money for that protection and peace of mind.
In this example, insurance buyers are paying premiums for protection and insurance companies are collecting the Volatility Risk Premium (VRP)
In trading it's the same. If an investor has a stock portfolio of mostly long positions, they could be in serious trouble if another financial crisis were to happen. They may feel it's worth it for them to hedge the portfolio against those potential loses. Buying options for example can put a floor price under the portfolio where no further losses can occur below that. However, that kind of risk mitigation isn't free, it requires a premium to be paid.
In this trading specific example, the option buyer is paying a premium for portfolio protection, and the option seller is collecting the Volatility Risk Premium (VRP)
So the Volatility Risk Premium is just a representation of the fact that the future is unknown. Many people have an emotional tendency towards risk aversion and there is a premium to be paid for that.
The VRP ebbs and flows with the perception of risk in the market, but long-term it will always be there. In essence it's the reason why most skilled options traders tend to play more on the short volatility side of the equation. Knowing that the markets have a natural tendency to overprice future unknown events, a skilled risk manager can use this to their advantage and profit from it. Essentially becoming the insurance company collecting the VRP, rather than the customer paying the VRP. Options selling is an attempt to capture the VRP.
Quantifying the Simple VRP again:
Since VRP is just a measure of the difference between implied and historical volatility, the easiest method by far to quantify it is through the following formula:
Simple VRP = VIX - SPX HV(20)
-
VIX is the actual value of the VIX index
-
SPX HV(20) is 20-day historical volatility on the S&P 500
It does a reasonable job of representing the VRP, but I have a more robust method of calculating which I call the Traders VRP.
Quantifying Traders VRP:
There are a multitude of "metrics" out there that do a reasonable job in timing the market in the medium term. However, to be truly effective in trading we need metrics that are faster reacting and useful in the short term. That is easier said than done, but I believe the Traders VRP does a good job of this.
By making a few modifications to the Simple VRP formula, we can increase the robustness of the signal a significant amount:
* After seeing all this, you may say to yourself, "I'm glad Brent calculates this all for us and gives us the final value every day in the Volatility Dashboard" but here we go with some math :)
Traders VRP = 5-day WMA of [ VX30 - SPX HV(5) ]
-
WMA is the weighted moving average
-
VX30 is a 30-day constant maturity VIX futures contract
-
SPX HV(5) is 5-day historical volatility of the S&P 500
There's 3 main adjustments I've made in that Traders VRP formula compared to the Simple VRP, let me explain each of them:
1) WMA stands for weighted moving average. It's a method of calculating a moving average that gives more weight to recent data points. I use a 5-day WMA meaning the most recent day will have the highest weighting, the 2nd most recent day the 2nd highest weighting, all the way down to the 5th day which has the lowest weighting.
Using a weighted moving average improves the reactiveness of the signal and means it's more effective on shorter time frames, which is very important if we're trying to exit positions before any major damage is done.
Weighted moving average = [ (V1 * 5) + (V2 * 4) + (V3 * 3) + (V4 * 2) + (V5 * 1) ] / 15
-
V1 is today's value of VX30 - SPX HV(5)
-
V2 is yesterday's value of VX30 - SPX HV(5)
-
V3 is 3 days ago ...
-
V4 is 4 days ago ...
-
V5 is 5 days ago ...
2) VX30 is a rolling 30-day constant maturity VIX futures calculation. This is the same method that the various volatility ETPs use in their methodology. Taking into account the days to expiration, it's a weighted average of the 1st and 2nd month VIX futures values (M1 & M2)
VX30 = Adjusted M1 + Adjusted M2
where:
Adjusted M1 = M1 * (DTE * FR) Adjusted M2 = M2 * [ (100% - (DTE * FR) ]
-
M1 is the front month VIX future
-
M2 is the 2nd month VIX future
-
DTE is the number of days to VIX futures expiration
-
FR is the percent daily shift in VIX futures weighting
* Since people are often confused about the futures roll, this captures a portion of the methodology of how the volatility ETPs derive their price. Every day as the VIX futures roll forward they are holding slightly less of the 1st month M1 and slightly more of the 2nd month M2. This shift in holdings is what I call the "futures roll" FR and it's calculated by taking the number of days to expiration of the monthly VIX futures cycle and weighting M1 & M2 accordingly.
3) SPX HV(5) is the 5-day historical volatility of the S&P 500. I use the 5-day for the Traders VRP instead of the 20-day in the Simple VRP because this shorter duration captures more of the recent action, again making it a much faster and more robust signal.
I warned you that you'd probably just want to look at the Traders VRP value I provide for you ever day instead of calculating it yourself, but that's what I'm here for. To give you some trading ideas that you may not have thought of yourself. I hope this has given you some ideas to run with...
Practical application of Traders VRP:
Since the vast majority of my work at Volatility Trading Strategies and VTS Options is volatility specific, the Traders VRP naturally has a lot of applications with respect to volatility ETPs and options trading. That's why I designed it and how it's used in my own day to day trading. However, I do have to keep a few cards close to my chest so I will save those explanations for another day. Broadly speaking though we can conclude the following:
- All other things being equal, higher positive Trader VRP values are associated with stable periods in the market and may be a tailwind for long S&P or short volatility positions.
- All other things being equal, lower negative Trader VRP values are associated with uncertainty and risk in the market and may be a tailwind for short S&P or long volatility positions.
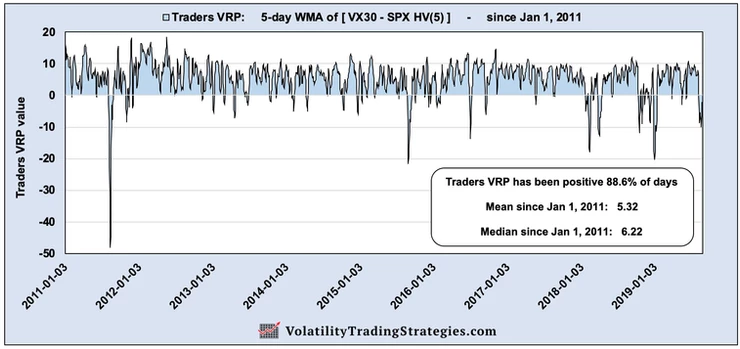
Traders VRP values since Jan 1, 2011
(there is no significance to that date other than it's also the start date of my VTS Volatility Barometer)

You can see the vast majority of the time it's positive and only dips negative during periods of uncertainty in the market. The European debt crisis in 2011, the steep market decline in 2015, and also several negative readings in the last two years.
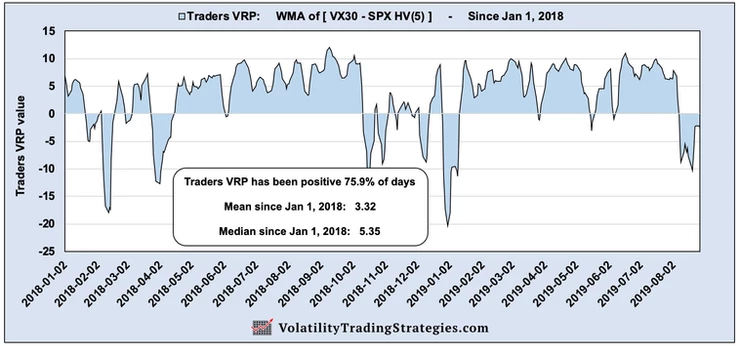
Traders VRP values since Jan 1, 2018

You can definitely see we are in a period of elevated uncertainty since the start of 2018. The Traders VRP has been negative nearly 25% of the time, and the mean and median are significantly lower as well. I won't say it's quite ominous just yet, but it's definitely something to keep an eye on.
Can Traders VRP be used to time the market?
One very simple truth that I have always believed is, if a trading metric can't be demonstrated to at the very least improve the performance of buy and hold on the S&P 500, it's not worth paying attention to.
Now like I said I find the practical applications much more geared towards options trade selection and filtering for potential volatility trades, but improving on the S&P is a baseline minimum standard. Let me show you how the Traders VRP could potentially be used in its most basic application.
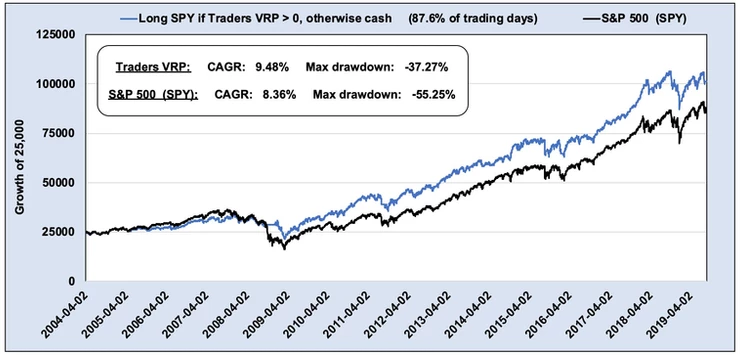
Since 2004: Long SPY if Traders VRP > 0, otherwise cash

The signal just filtered out about 13% of trading days which was enough to see a significant performance improvement, and more importantly a dramatic reduction in the drawdown. From a risk adjusted perspective the Traders VRP significantly outperforms a buy and hold on the S&P 500.
I will leave the optimization to you. Use your imagination and see what you can come up with.
Take Control of your Financial Future!
Profitable strategies, professional risk management, and a fantastic community atmosphere of traders from around the world.

