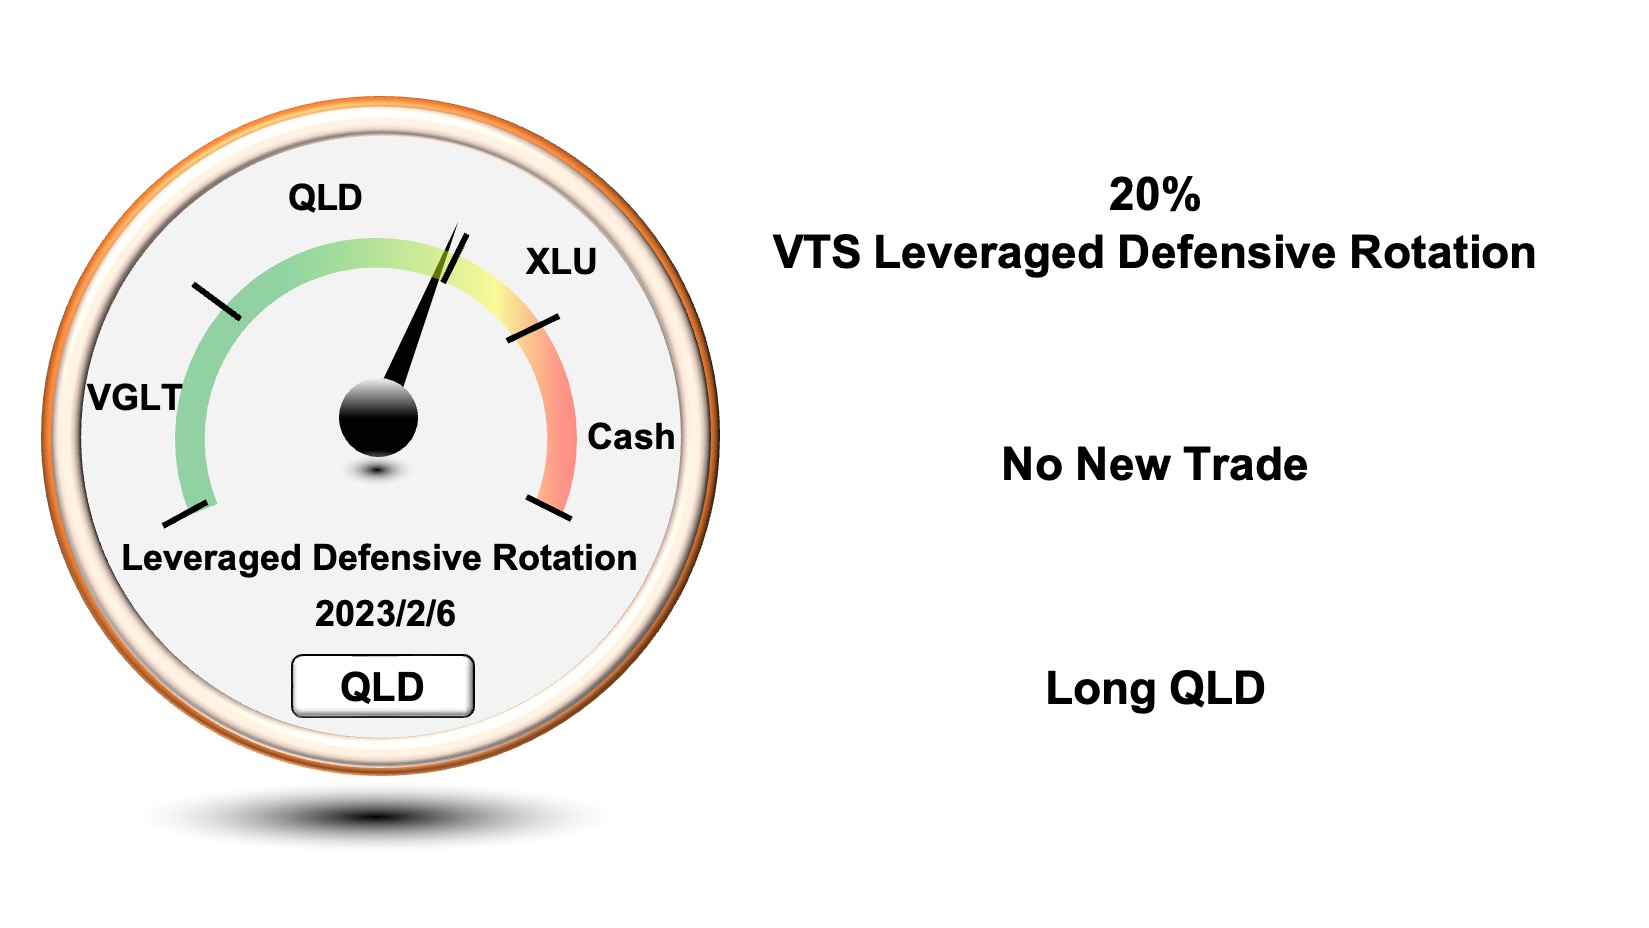
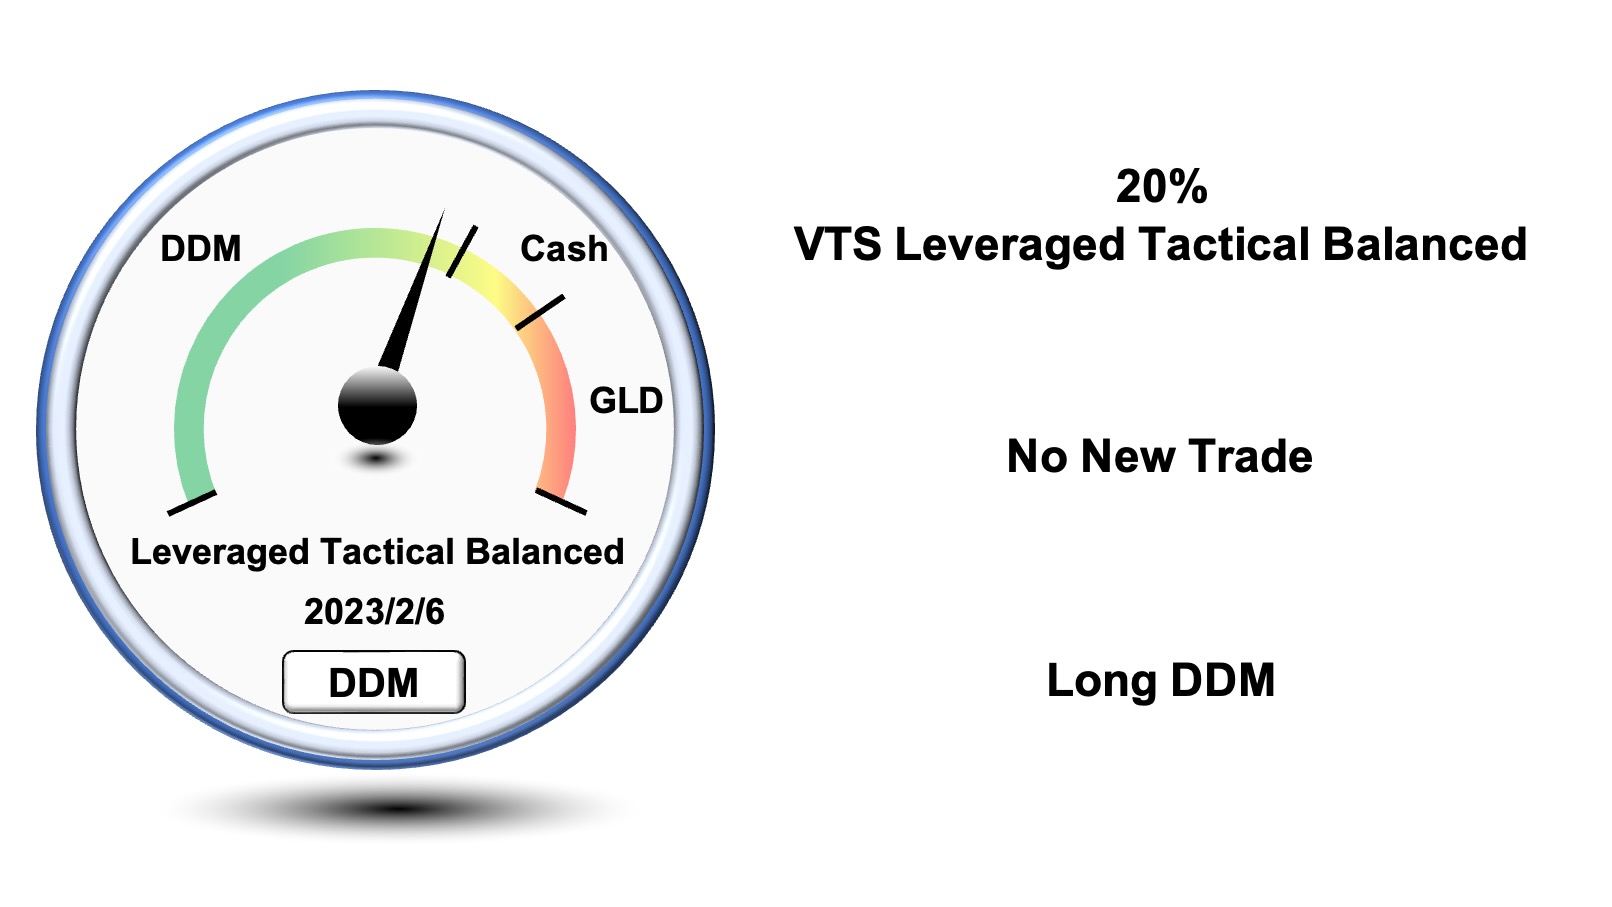
3 VTS Strategies with 3 Different Volatility Influences
Feb 06, 2023
VTS Community,
Last week we exited our DDM (Dow Jones) position within the Tactical Balanced strategy for 2 days. That's the first time we've exited that position in over two months. I had some questions on why that strategy would exit to cash when the QLD Nasdaq position in Defensive Rotation did not exit.
I think today would be a good day to unpack the difference in Volatility Metrics between our three tactical strategies because the timing between them isn't the same. I know the trade dials line up pretty closely most of the time so it appears they are using the same metrics, but it's important to remember they are not.
* All three of them use a different set of Volatility indicators
The reason I use a different variation of the volatility metrics for each of our strategies is because I'm trying to differentiate the timing of the signals and increase overall portfolio diversification. If we want to reduce inter-strategy correlation as much as possible, they each need their own entry and exit metrics.
1) Strategic Tail Risk Strategy
* Main focus: Entire Volatility Barometer

The Strategic Tail Risk Strategy is the only one we have that DIRECTLY uses the Volatility Barometer readings exactly as they come. That means whatever the Volatility Barometer points to, that's the position we take.
If it says 54% we will be in the S&P 500. 56% we will be in Cash etc...
The VTS Volatility Barometer mines data for 13 sources to be the most comprehensive Volatility indicator. Strategic Tail Risk uses it directly.
Rewatch the strategy video here
2) Defensive Rotation Strategy
* Main focus: VIX Futures related indicators

The Defensive Rotation Strategy uses 5-6 metrics in its calculation, but the majority of the influence does come from the VIX Futures specific metrics. The way I do it is use a suite of 5-6 metrics and then weight VX30:VIX roll yield and Adjusted M1:M2 VIX futures more heavily.
Rewatch the strategy video here
3) Tactical Balanced Strategy
Main focus: Cash VIX Term Structure related indicators

The Tactical Balanced Strategy again uses about 5-6 metrics for timing the entries and exits, but the majority of the influence comes from the Cash VIX Term Structure specific metrics. It's several metrics with the main weighting going to the VTS Cash VIX Oscillator.
Rewatch the strategy video here
Volatility Metrics are very effective, but need variation
For a truly diversified portfolio I feel it important to find ways to differentiate the strategies while still maintaining the general principle that Volatility Metrics are the best timing signals. Not using the same set for each strategy is an excellent place to start. The other ways would include:
- Staggering the flip points so each strategy has a different running exposure level to stocks or safety positions
- Using different asset classes within each strategy to further diversify the Total Portfolio Solution holdings at any one time
No portfolio will ever get things right all the time, but long-term I have found no better way to invest than tactically rotating between the highest probability of success asset classes based on analyzing Volatility Metrics.
Take Control of your Financial Future!
Profitable strategies, professional risk management, and a fantastic community atmosphere of traders from around the world.

