Volatility ETF Trading Strategies - Part 2: VRP Volatility Risk Premium
Nov 02, 2013* I’ll update the charts and commentary in these very old articles every now and then so that the data is stretched over longer periods of time. Last updated Nov 2015 *
In this series of five posts I’m going to be going into a little more detail about some of the most common methods of trading the various volatility ETP’s such as XIV and VXZ. I think it’s important that subscribers in the VTS community at least have a basic understanding of the complexity of these products as well as some of the potential drivers of possible strategies. The five part series will cover:
- VIX Futures Term Structure
- Risk Premium (VRP)
- Mean Reversion
- 30-day Constant Maturity
- VIX : VXV Ratio
Part 2: Volatility Risk Premium (VRP)
In terms of definition, the volatility risk premium is just the additional premium investors demand in order to hold a security. Since future prices are unknown there is naturally a level of forward uncertainty that has to be priced in. We separate volatility into two parts, past and future.
-
Historical or realized volatility is what we actually observed over the previous month (past)
-
Implied volatility is what market participants are pricing in over the next month (future)
The difference between these two can loosely be called the volatility risk premium and essentially means there is a discrepancy between what has already happened, and what market participants are expecting to happen going forward.
To get even more specific we are essentially talking about the differences between the value of the VIX Index which is a measure of future implied volatility compared to the historical or past volatility on the S&P 500.
In theory it’s a clever way to predict the future price movements of the XIV because the volatility risk premium is a function of human nature itself. We have a natural tendency to overestimate future unknown events, but in reality they are often less impactful.
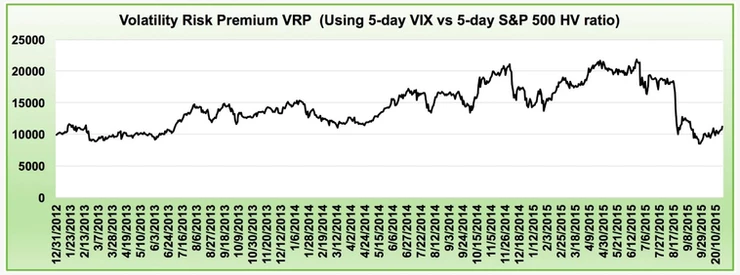
So what would a Volatility Risk Premium strategy look like? The most common form is using a formula that subtracts the historical volatility on the S&P 500 from the current price of the VIX Index. To smooth out the results, I’ll use a 5-day average of the VIX minus a 5 day average Historical Volatility reading on the S&P 500.
*I’m using January 2013 – present because live trading at Volatility Trading Strategies began in January 2012 and I want to give it a year for more robust comparisons.

As you can see in the chart, it was a pretty good indicator of future XIV price movements during the bull market phase from January 2013 through late 2014, but since then it has completely broken down and has performed miserably since then. The indicator is barely positive for this three year period.
Why did this happen? Essentially this discrepancy between implied volatility and realized volatility can persist well into a sell off, because what was true before the decline is still true during and after as well. There is often a higher pricing of implied volatility. It’s quite possible there is no crossover in pricing that would indicate a change in direction as the entire function just shifts up or down, which means traders using this as an indicator are left holding through good times and bad as both implied and historical vol rise together in tandem.
In the volatility trading space, I’d say the majority of traders have relied on the volatility risk premium for their signals and because of this, these traders find themselves no further ahead in their results than they were 2-3 years ago.
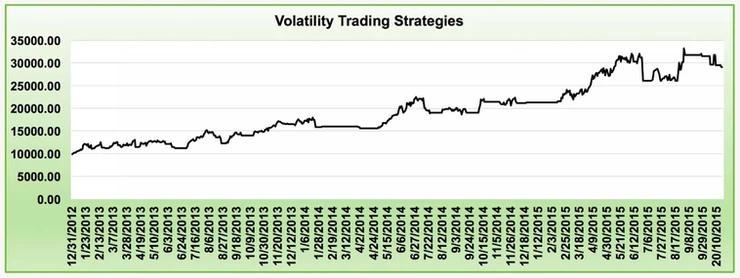
At Volatility Trading Strategies the VRP indicator only accounts for a very small portion of our trading system so we were not subjected to those horrific drawdowns that many of our competitors suffered. Here’s our results:

Take Control of your Financial Future!
Profitable strategies, professional risk management, and a fantastic community atmosphere of traders from around the world.

